|
Satellite Windows |
Control elements
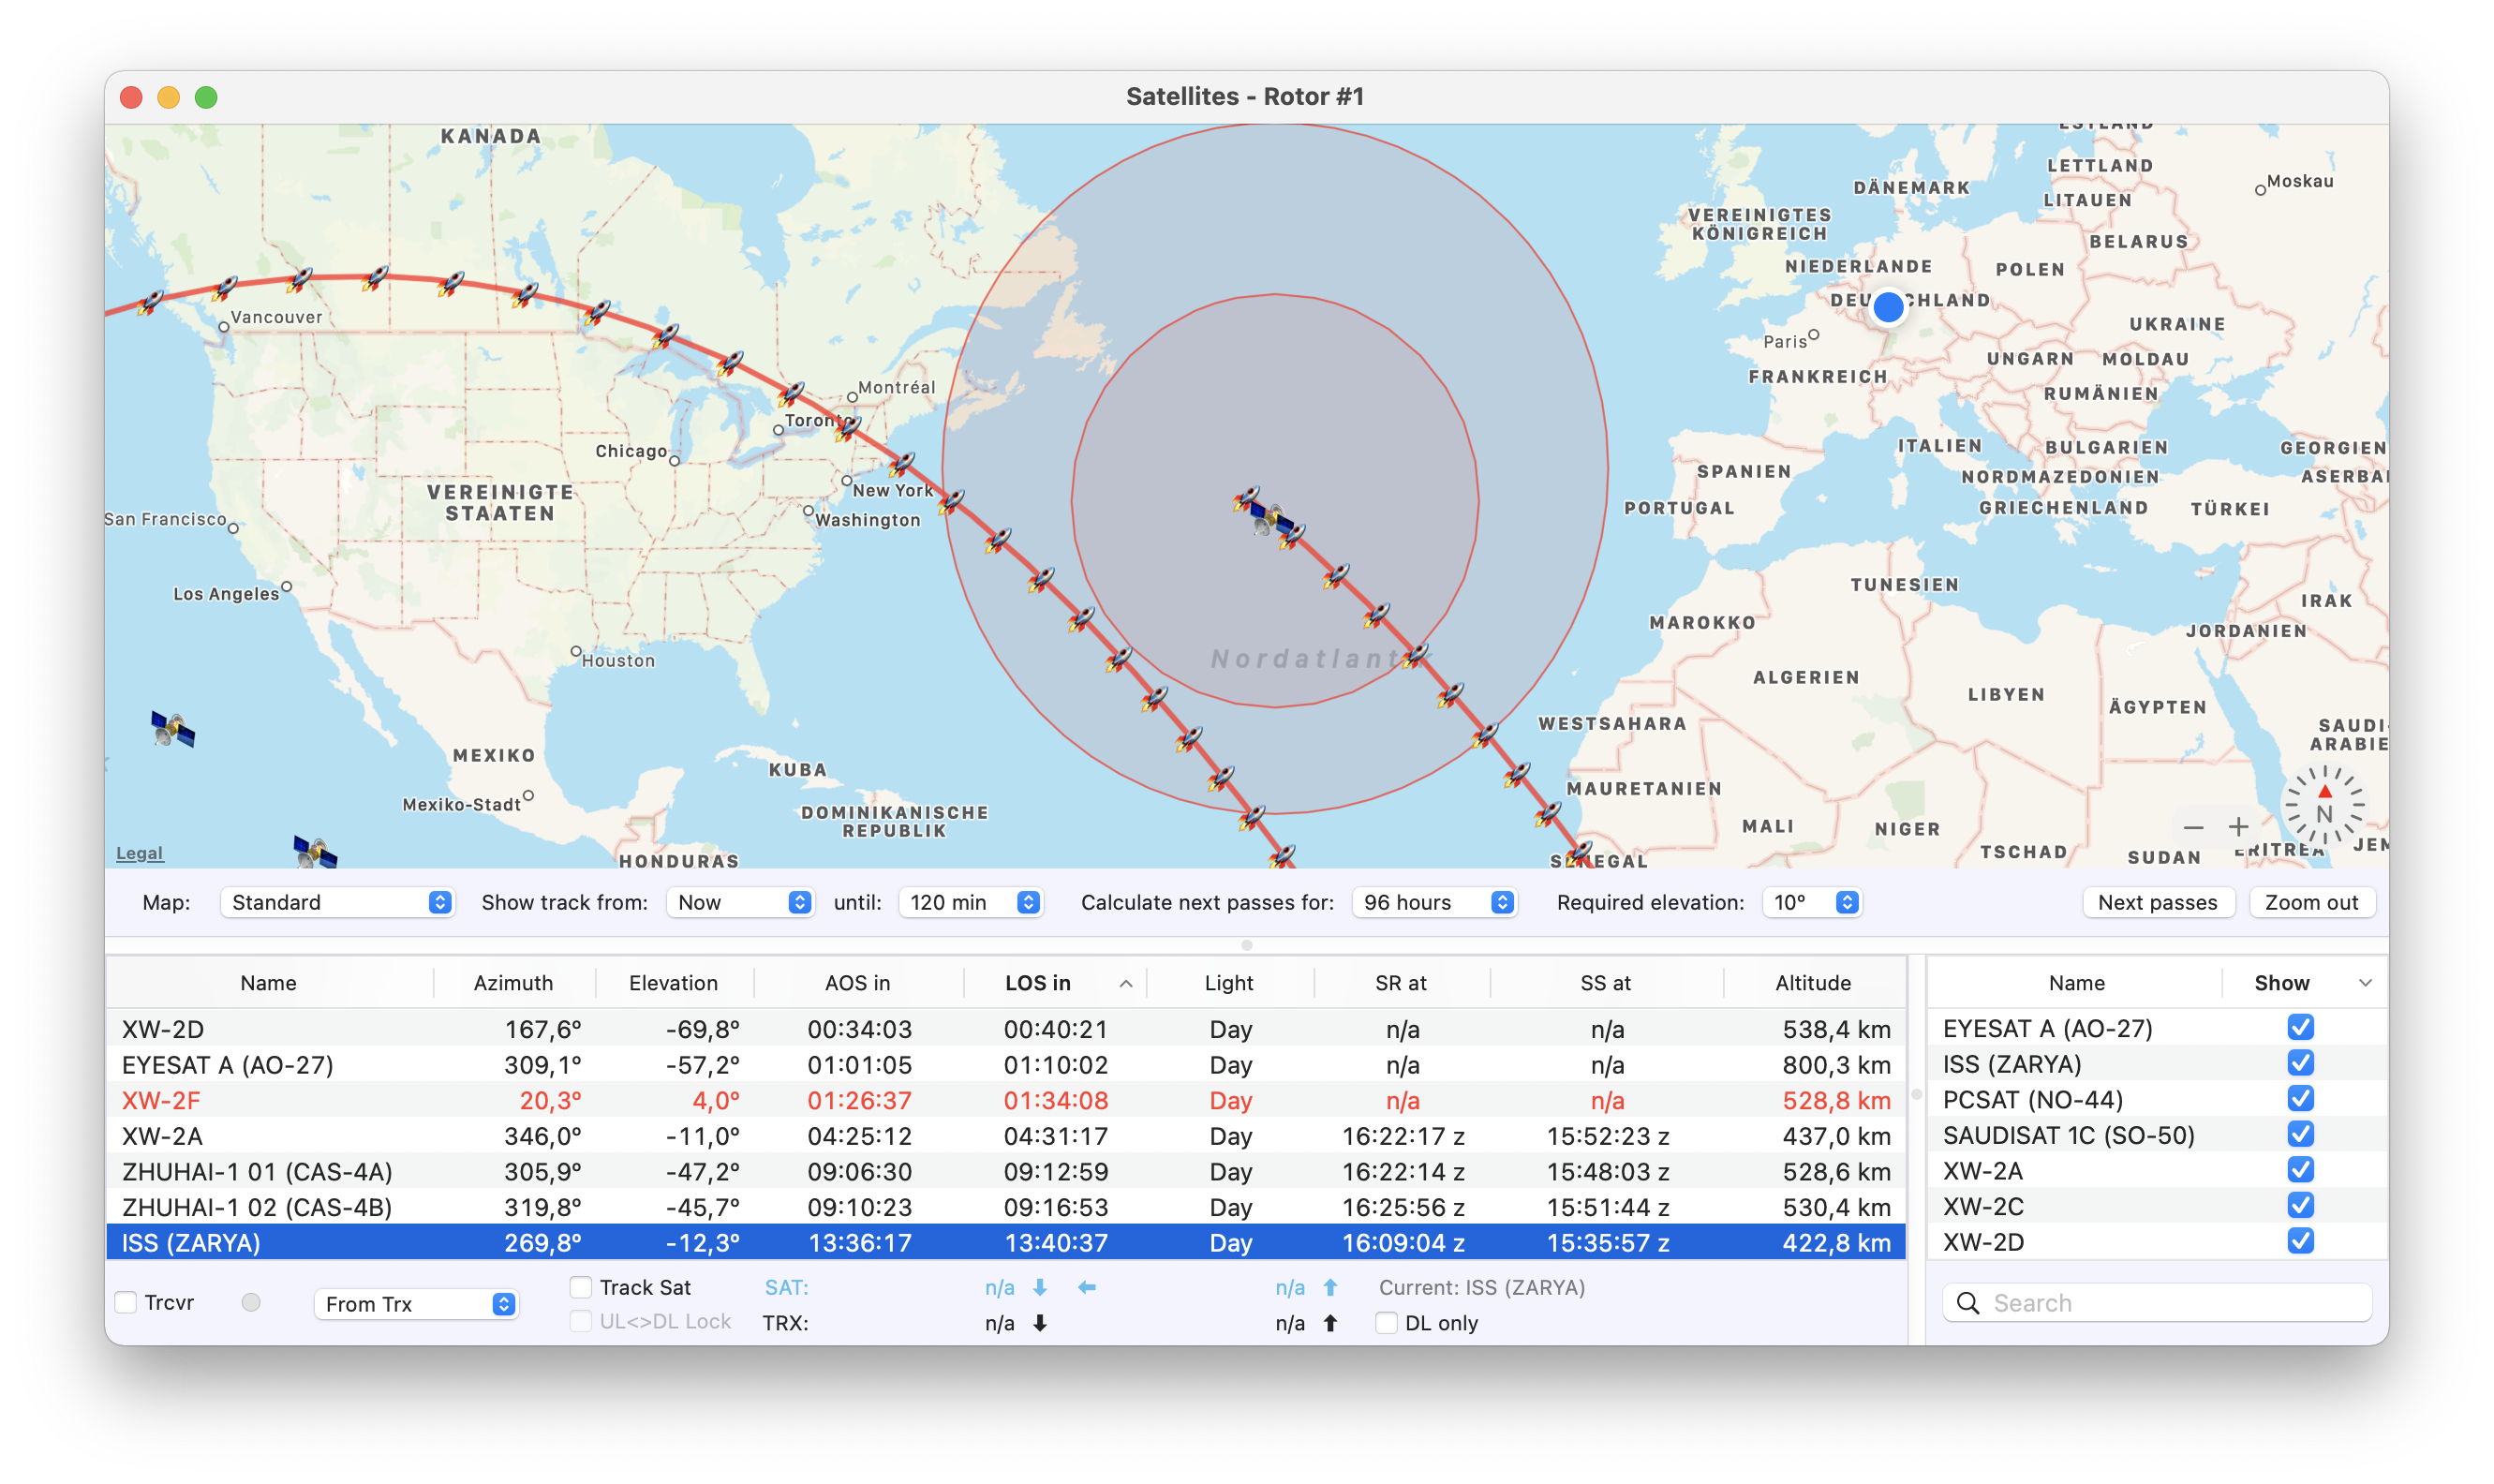
Map
Choose between different map styles provided by Apple.
Show track from/until
Click a satellite from the list and a track is drawn on the map depending on those settings.
Calculate next passes for
Sets the time frame for calculating next passes.
Required elevation
There might be obstacles in the vicinity of your location which bx line of site below a certain elevation. You can set the minimum required elevation such that Rotor calculates satellite receivability accordingly.
In case Required elevation is set to a value > 0 an additional ring is depicted on the map that shows your actual probability of receiving the satellite. As soon as the satellite comes over the horizon based on your location its data turns red and when its elevation is equal or higher than the set *Required elevation its data turns green**. The same color scheme applies to the Tracking Window.
Next passes all satellites
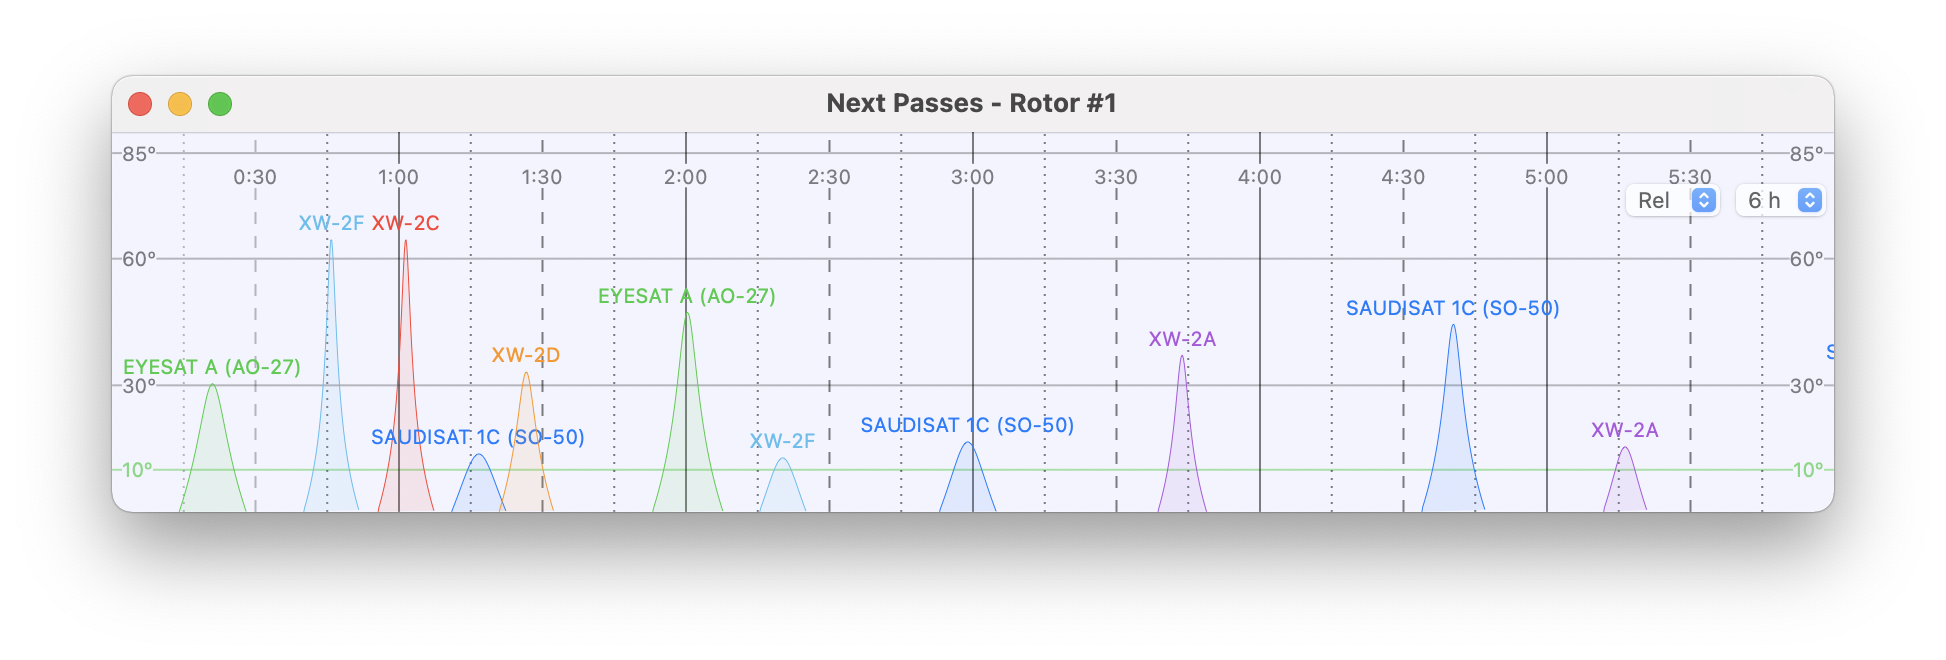
Use Menu -> Window -> Next Passes Window or press the provided button to use this window.
It opens a graphical view of all upcoming passes. In the upper right corner of the window you can select the time frame and whether you want actual times or relative times.
Next passes one satellites
This window is an excellent planning tool for a satellite’s next passes. Double click a satellite in the table to open this window. The table shows available time slots for the selected time period. Select a row to show the ground track on the map (blue line). On the map you can click one of the ‘rockets’ to see the footprint at this point in time. The graph below always shows a 24 hour time span (0000z - 2400z). Use the popup menu to select one of the next seven days. The green line represents your set required minimum elevation.
The polar coordinate window shows the following:
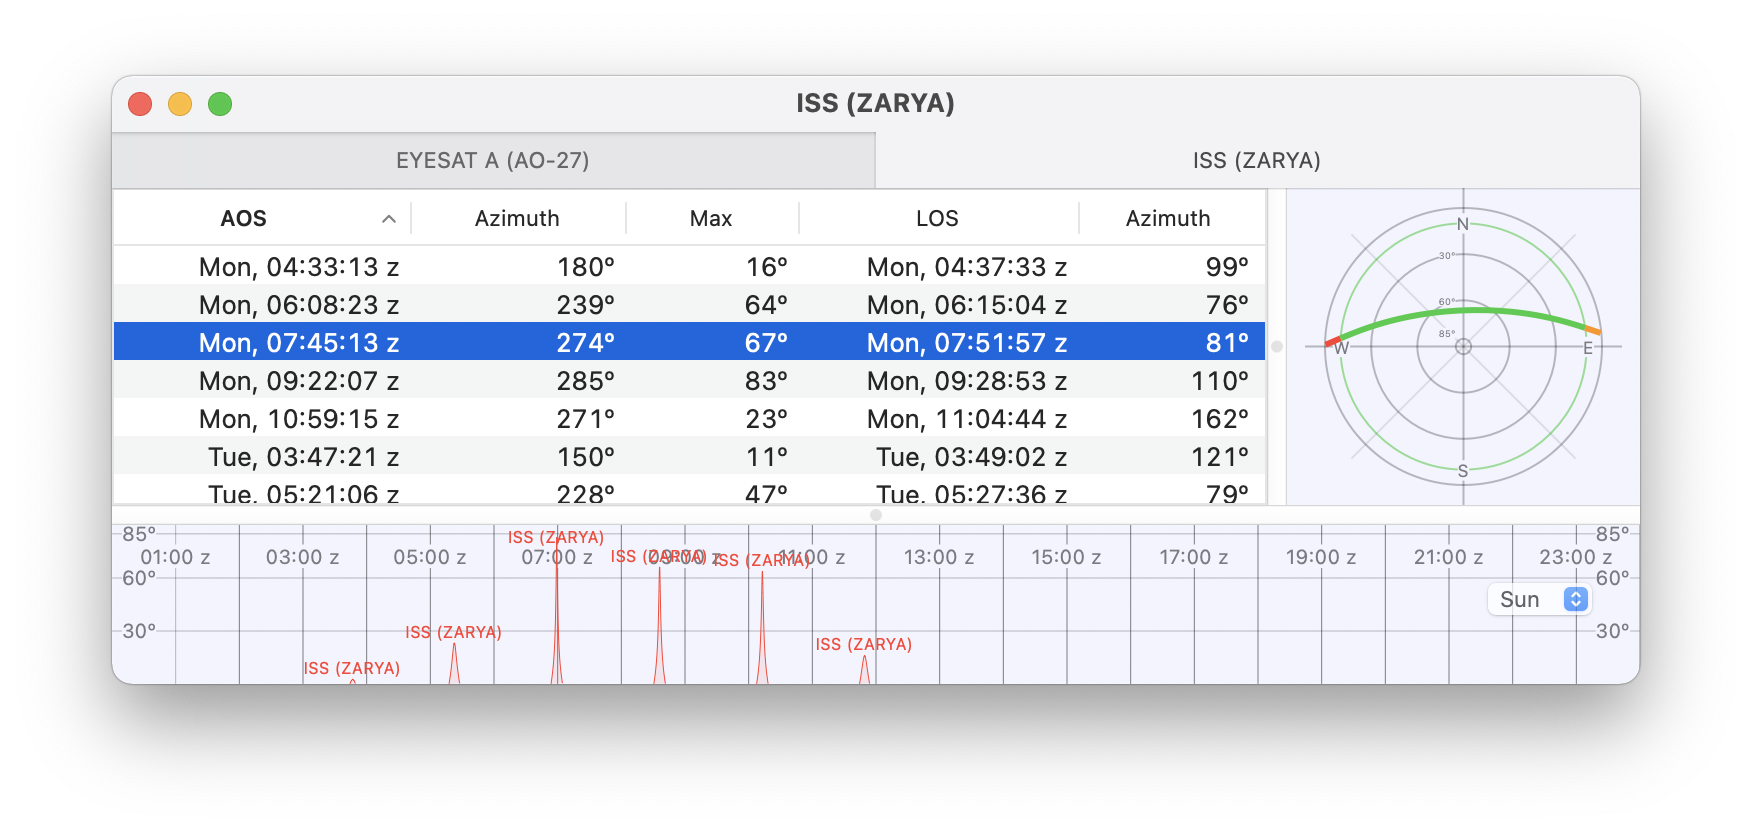
- Green circle: your selected required minimum elevation (if set > 0º)
- Red line: AOS (Acquisition Of Signal) when below minimum required elevation
- Green line: above minimum required elevation and in sun light
- Blue line: above minimum required elevation and not in direct sun light
- Orange line: LOS (Loss Of Signal) below minimum required elevation
Hint: All three parts of this window are located on split views. You can adjust the size to your convenience.
Sked Prediction Tool
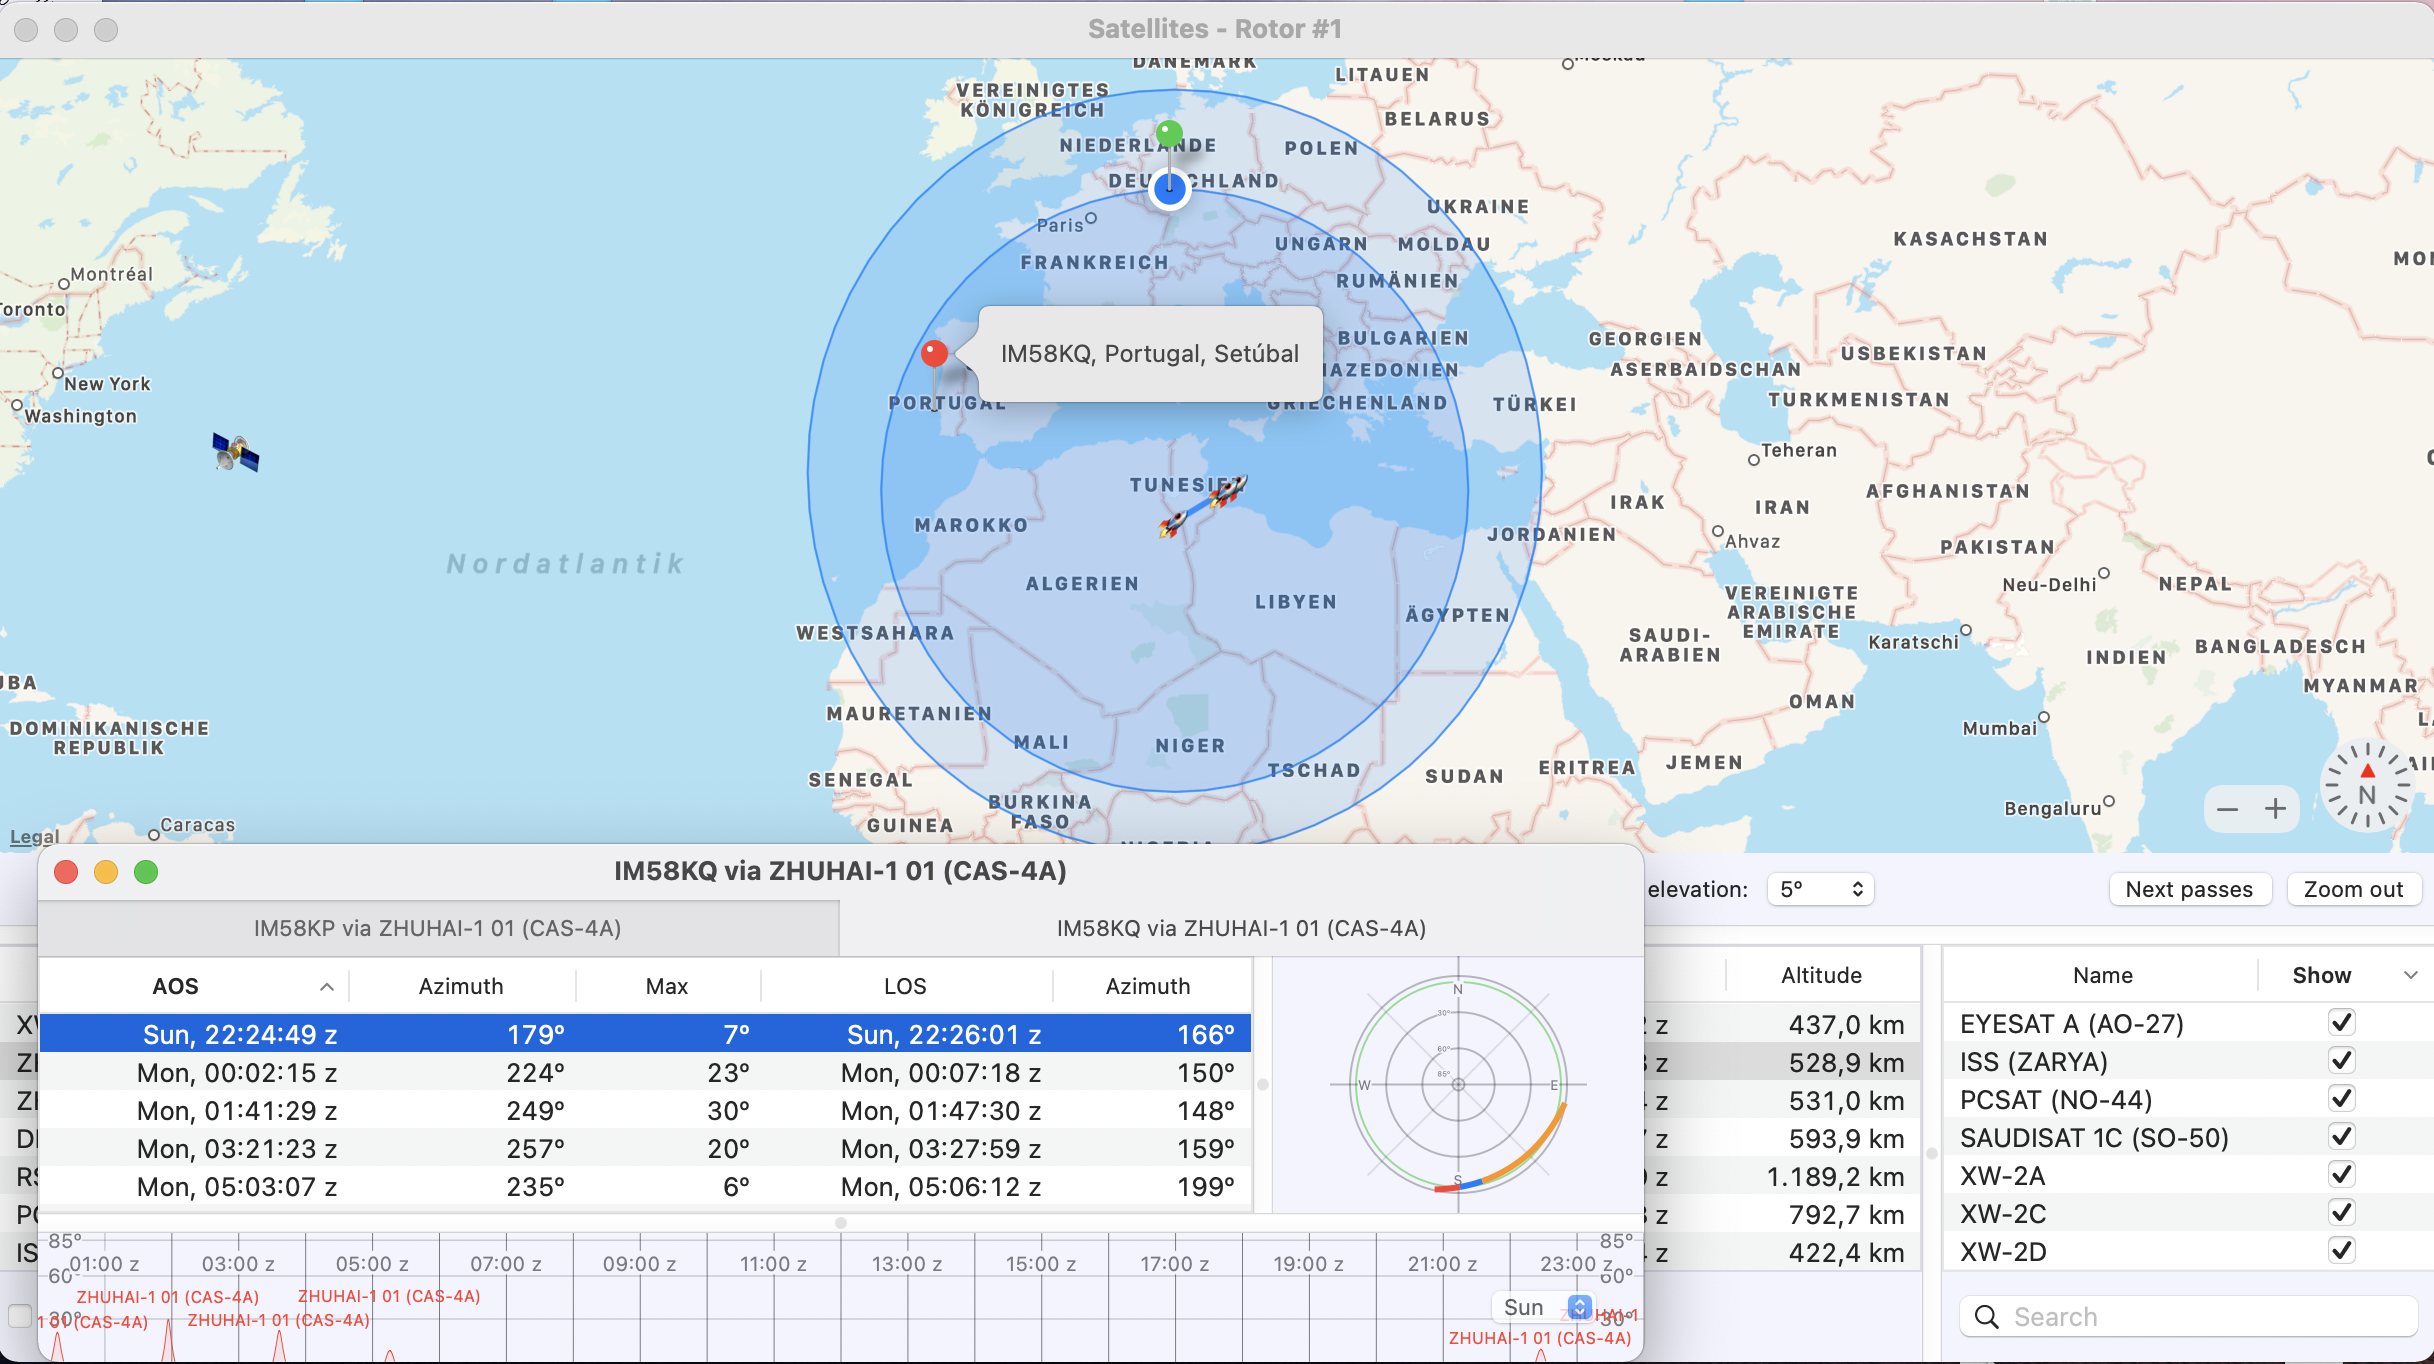
If you want to find out if and when a specific location can be reached via a particular satellite first select the satellite from the list. Then right-click the location you want to reach on the map. A red needle will show up and the Next Passes Window opens. The prediction is based on the time set in “Calculate next passes for”. If the window is empty no connection will be possible.
Note: The blue (dark) or green (sun light) line in the polar coordinate view now represents the satellite, where it is above your selected minimum elevation and just above the horizon at the dx location.
The example below illustrates a possible connection between Germany JO40 and Portugal IM58 using CAS-4A at the point where the time slot starts.