
|
Miscellaneous Windows |
Here is a short overview of a few useful windows.
Search entities
Search the log for DXCC entities and the related QSOs.
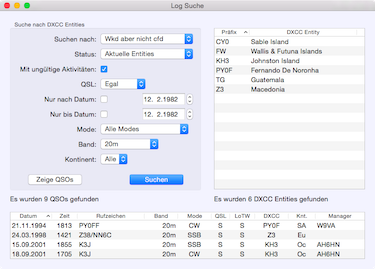
The results from a search can be presented on a map: Menu–>QSO–>Show entities on map.
If there are QSOs shown in the table, the function Menu–>QSO–>Select stations using OQRS may also be helpful.
Search QSOs
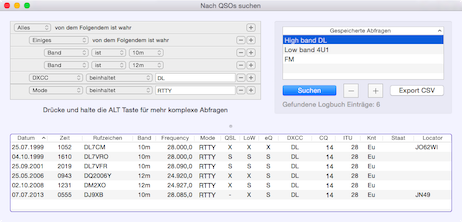
Here you can execute complex log searches for QSOs. Once created, queries can be stored and recalled with a mouse click.
The log table header contains a contextual menu for selecting the entries to show.
If any QSOs have been selected in the table, the following menu options become available:
- Menu–>Logbook–>Export ADIF (see below)
- Menu–>QSO–>Edit QSOs
- Menu–>QSL–>Paper QSL out
- Menu–>QSL–>Resend paper QSL
- Menu–>QSO–>Show selected stations on map
The search results can be saved in CSV or ADIF formats. To export only some of the QSOs please select them in the table. Otherwise, all the listed entries will be exported!
If there are QSOs shown in the table, the function Menu–>QSO–>Select stations using OQRS may also be helpful.
Band Map
The band map shows dx cluster spots near your trx frequency. The color-coding is similar to the DX spot window. Click on a callsign to transfer its data to the log entry area.
To remove an entry from the band map Cmd-click on the callsign.
Click in the band map for a quick QSY.
The contest module uses its own band map, see the contest section for further information.
DX List
This list shows the confirmation status on every band for all DXCC entities. It is shown as a sequence of three characters, each representing CW-Data-Phone:
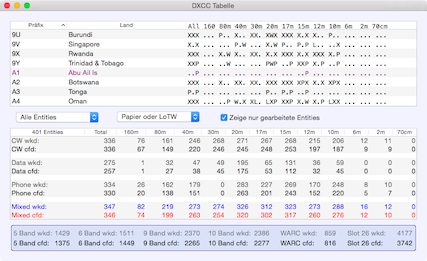
- .: not worked
- W: worked, but not confirmed
- P: confirmed by paper QSL
- L: confirmed by LoTW
- E: confirmed by eQSL
- X: LoTW and paper QSL confirmed
Log Statistics
The following tables may be useful for award tracking:
- CQ zones
- ITU zones
- IOTA
- 2/4-digit grid squares
- Prefixes
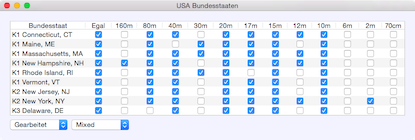
- US-States
- US-Counties
- German DOKs
These windows do not refresh after any changes to the log. To recalculate, close and reopen them.
The tables can be sorted by band by clicking in the table header. The tool tip shows the number of entries per band. To see it, move the mouse over a band column (not the column header) and wait for a moment.
When you move the mouse over a CQ or an ITU zone number the tool tip shows its related prefixes.
Grayline Map
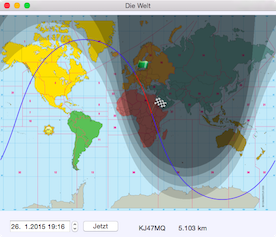
This real-time map shows the positions of the Sun and the twilight zones. Click on the map to show the straight line paths from your location. You can see the map for other times and dates by entering them in the bottom-left.
Areas in Gray Line
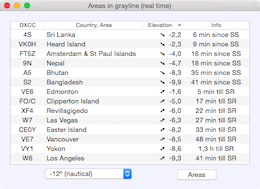
This real-time table shows all areas in the current gray line. You can define your own areas. They will be shown on the large Map window in purple letters.
Activity of the Sun
Data from: N0NBH
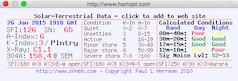
The displayed widget and background color can be modified following instructions from the website. The settings for this can be found in Preferences–>Databases–>hamqsl.com
Calculations
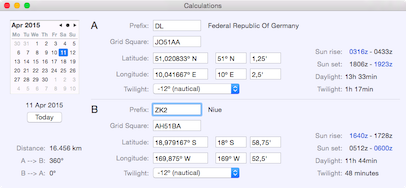
A quick way to convert between grid squares (up to 10 digits) and coordinates. When you enter any of the coordinates the solar times for that location will be shown on the right-hand side.
To make comparisons easier, two sets of entry fields have been provided. This allows you to calculate exact data for distances and directions.
Activity maps
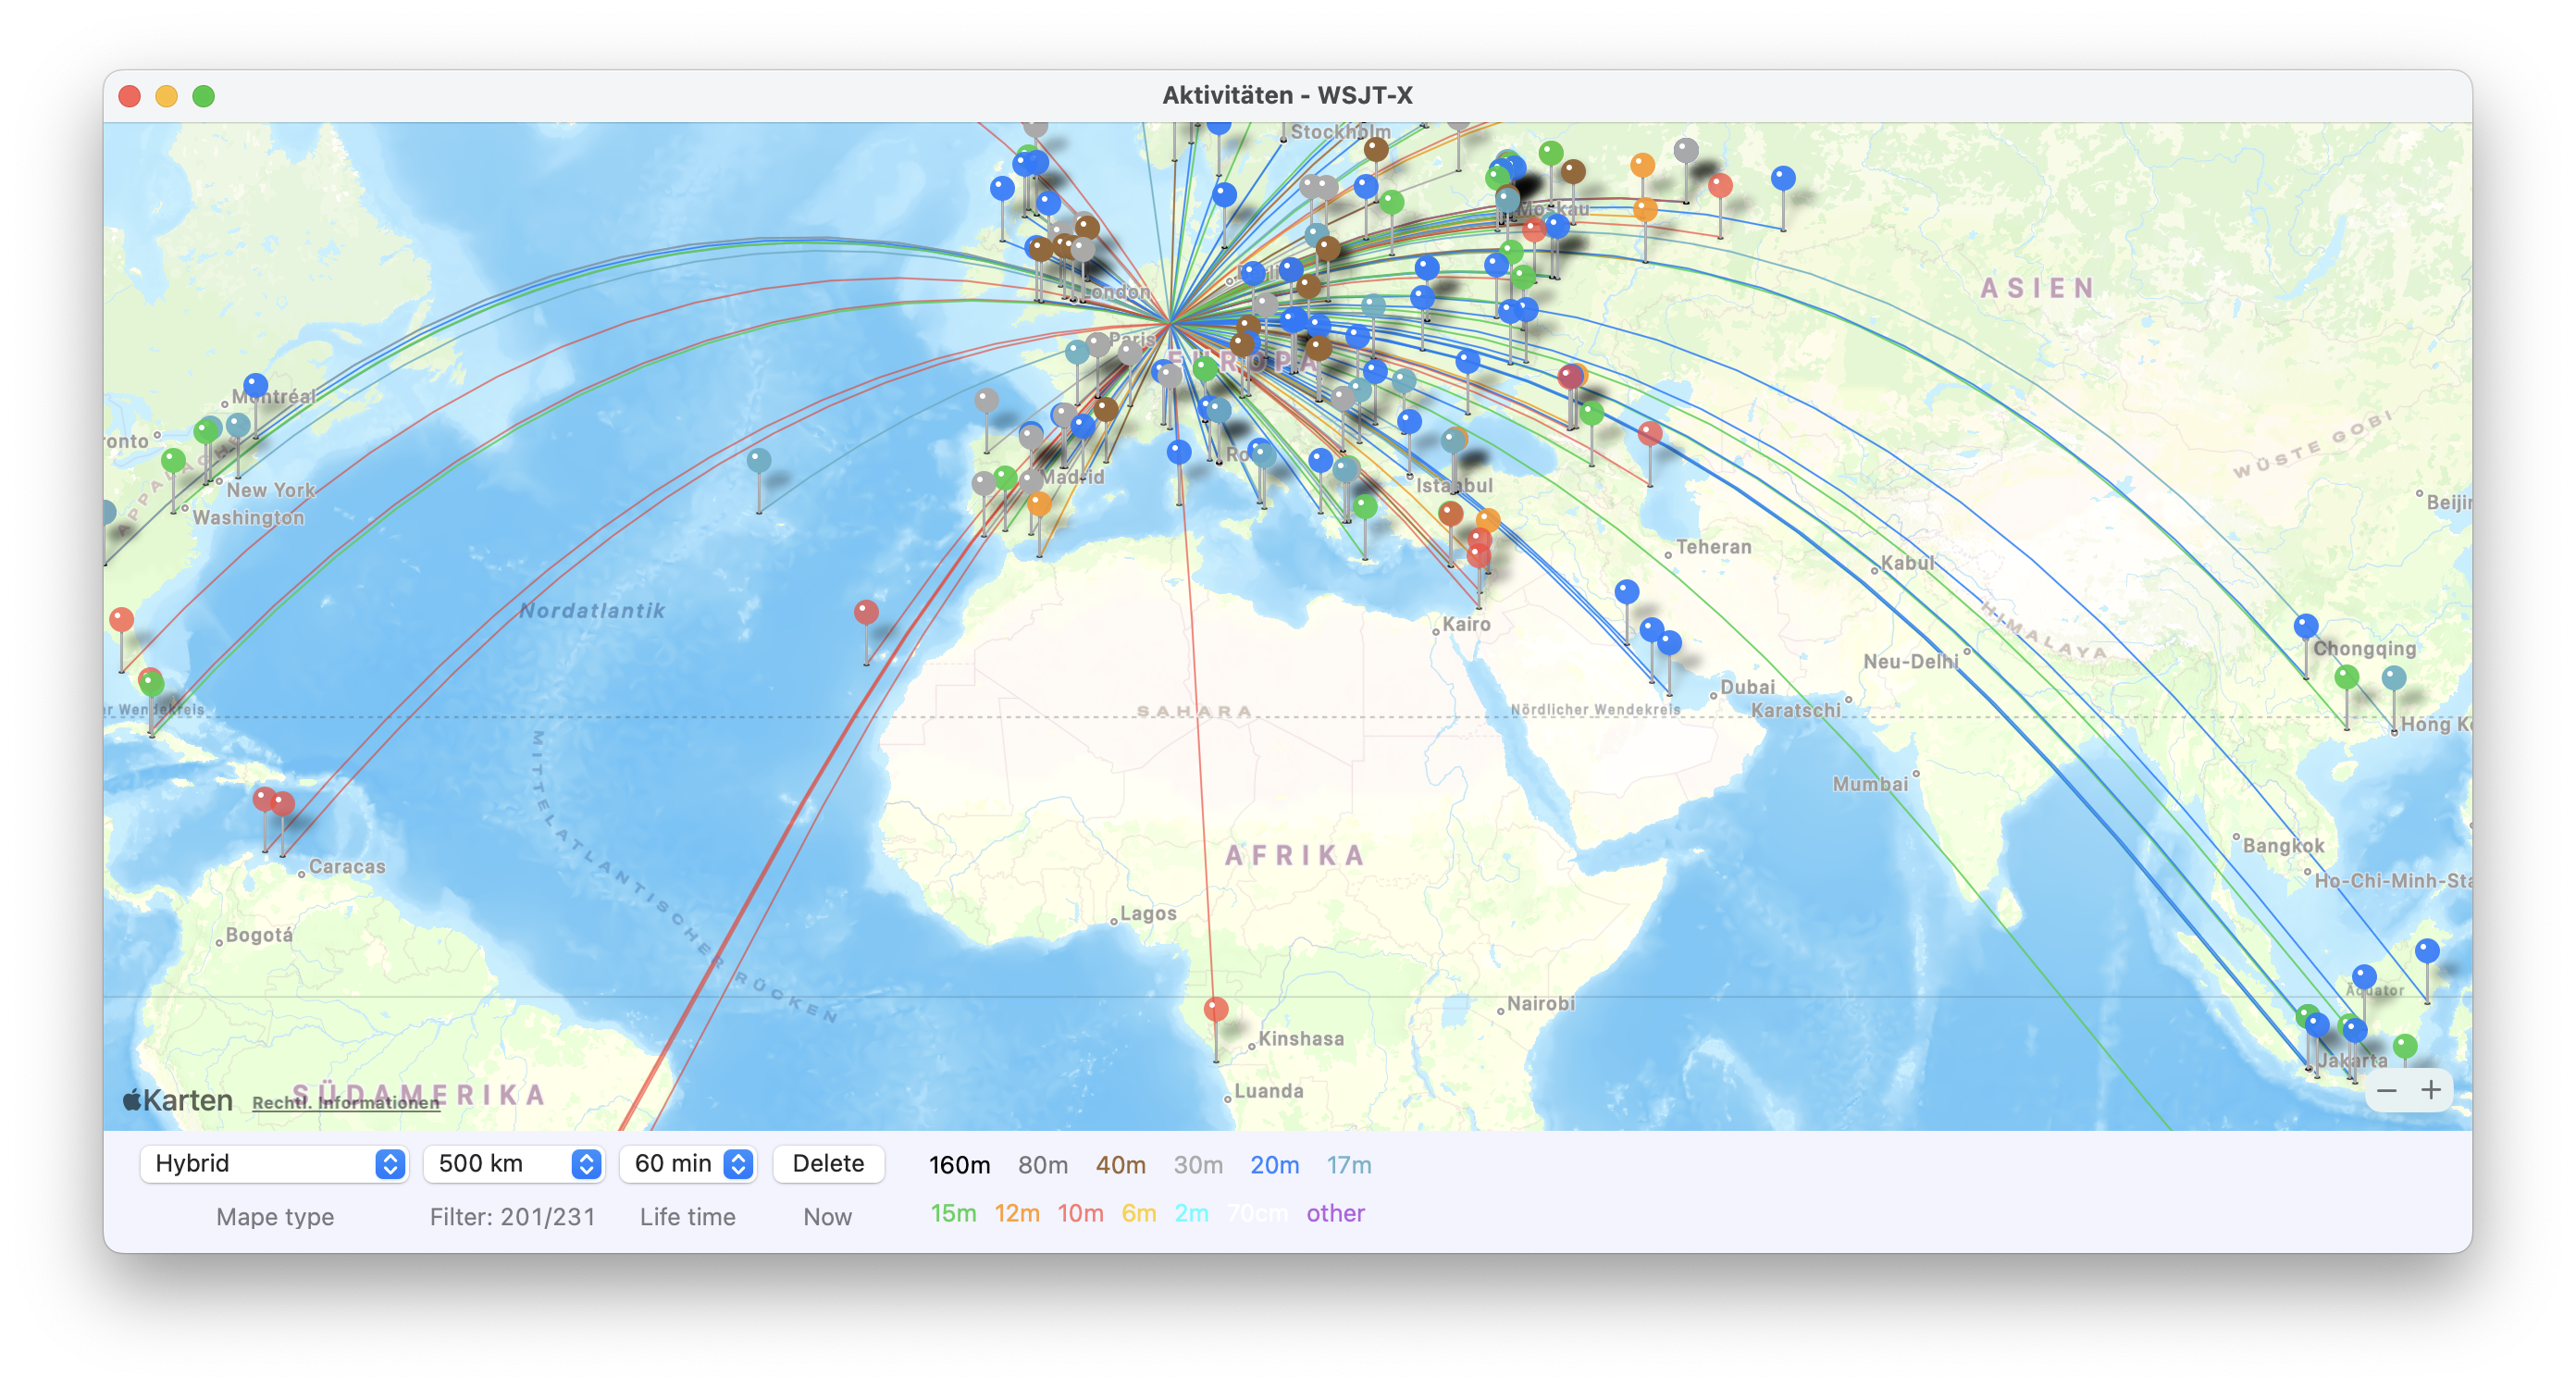
Band activities can be visualized on three maps from different sources. For this purpose, the station grid square is used, which is obtained from the Club Log database. The Club Log database must be loaded: Menu–>Online–>Load Club Log user data. If no grid data is found, the default grid square from the DXCC database is used. In these maps only one entry per locator and per band is shown.
The controls should be self-explanatory. The distance filter only hides stations below the selected distance; the data is not deleted.
The best representation is obtained if the map type Hybrid and the light representation are selected.
- WSJT-X: Used for data coming via the WSJT-X interface, such as JTDX or STEMlab Skimmer.
- Skimmer: Data from a Telnet DX cluster is used. This must be selected from all connected clusters, especially useful for local skimmers.
- Own QSOs: Shows all QSOs that are saved in the log or in the contest log. Imported QSOs will not be taken into account.